Showing posts with label Reporting. Show all posts

15 November 2006

SQL Developer 1.1. How Do I Build a Master Detail Report (with Chart)?

Perfect, a query on the Forum triggered a thought for this entry. "How do I create a report that has a table and chart in it?"

Let's start with a Master-Detail report.

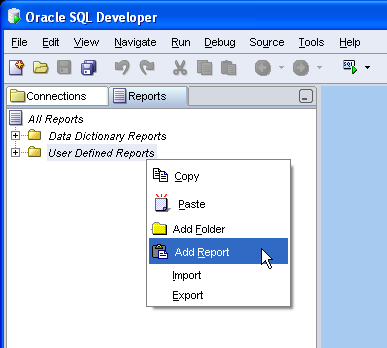
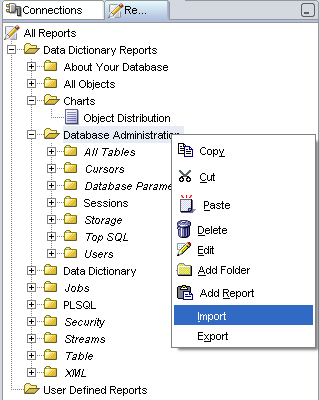
1. Using SQL Developer 1.1 Evaluation Release 2 (1.1.0.21.97) go to the reports tab and select "Add a Report" under the User Defined Reports. I'll leave you to fill in the name, description and tooltip details. The report we are creating uses the demo schema HR, with the EMPLOYEES, DEPARTMENTS and LOCATIONS tables.

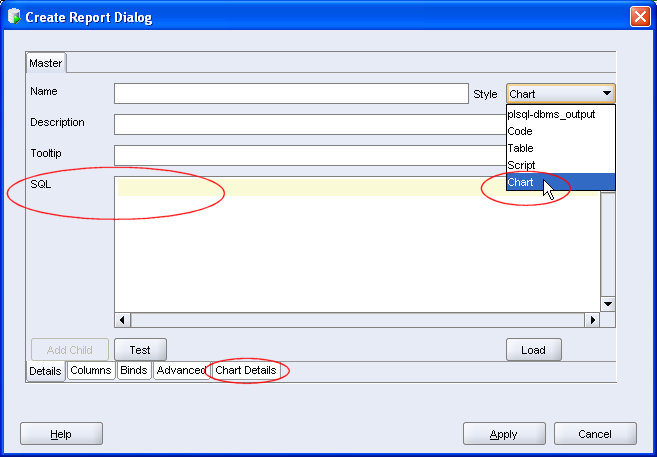
2. Although you only see one panel at this stage, you are creating the Master query. Set the Style as Table and enter the following query:

select d.department_id, department_name, city
from departments d, locations l
where d.location_id = l.location_id


Note: No trailing ';'

You can elect to test the reports at any stage, using the Test button.

3. Now to add the detail.
Select the Add Child button to open a new panel in the dialog.

The basic detail query, without chart or any complexities is as follows:

Select * from employees
where department_id = :DEPARTMENT_ID

Note: The bind is CASE sensitive. Also useful to note, the child query knows that this bind is from the table above.

Another example using that bind variable is:

select :DEPARTMENT_NAME, last_name, salary
from employees where department_id = :DEPARTMENT_ID

It is not that interesting, to have the department name in the detail records, because you'll just see that name duplicated.

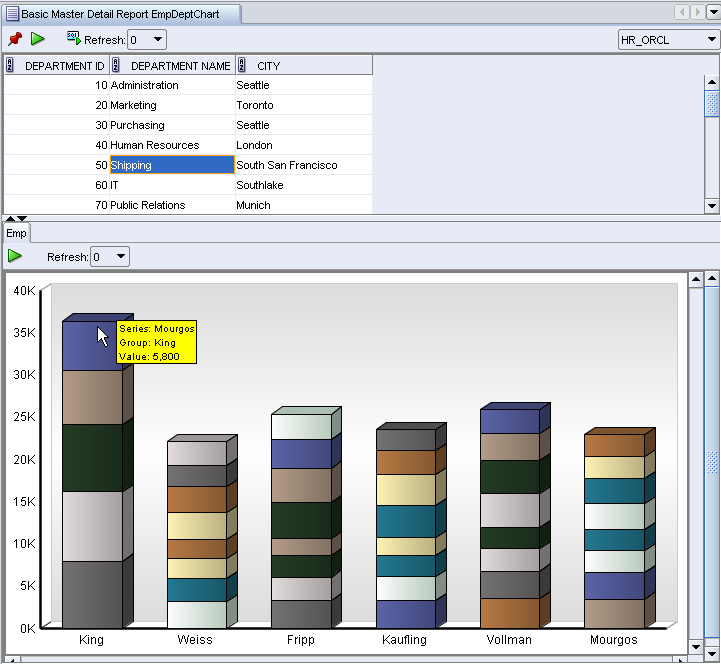
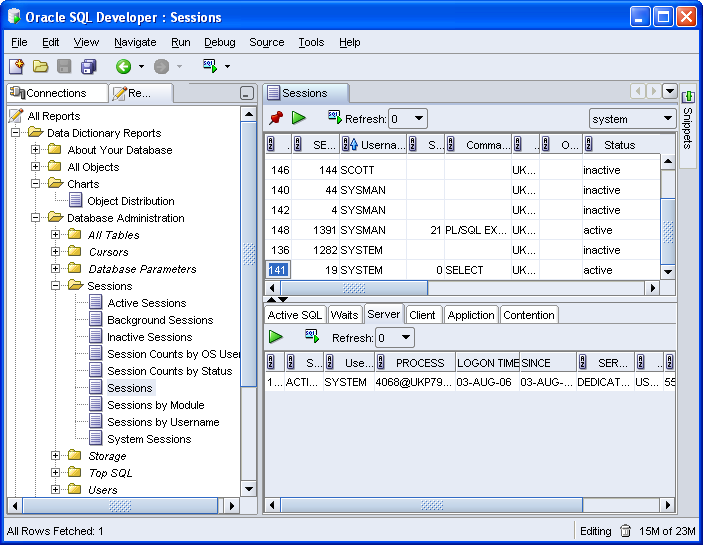
4. Run the report to see the master detail in operation.

That's it, a Master -Detail report in action.

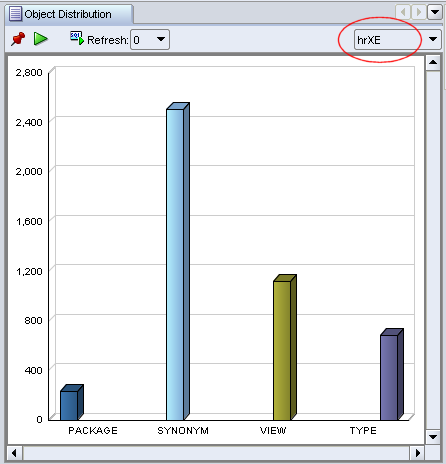
Making the Detail a Chart.

Let's take it further and pull the CHART into play...

5. Select Edit to open the report again.

From the previous blog entry on charts, you saw that we need to select X, Y and data, so we'll do the same here. Replace the child query with:

select m.last_name, e.last_name, e.salary
from employees e, employees m
where m.employee_id = e.manager_id
and e.department_id = :DEPARTMENT_ID

So now I am looking at the departments table and for each department, I want to know who works for each manager in that department and see their salaries.

To create the chart, set the child style to CHART and then look at the chart details and set them to BAR_VERT_STACK and select the Test button.

When you are happy select Apply. Here's mine:

13 November 2006

SQL Developer 1.1. How Do I Build a Chart?

I did a few "Sneak Peeks" into 1.1, in an attempt to show you what you might expect down the line. Now that 1.1 evaluation release is available, you can go back and look a those and find the features I mentioned.

I'd now like to take this further and do a series of "SQL Developer 1.1: How Do I ....", first using the evaluation drops as they become available and continue that into the production release.

In showing how to go about discovering new things and working with 1.1 in general, I could take 2 quite different approaches. The one approach would be to be quite organized and plan a whole schedule of entries and the other is to write random ad hoc entries that just jump in and out of the tool all over the place. I'm opting for the latter approach, because right now I am inspired to do a quite write up, just covering a basic chart in SQL Developer 1.1

Building a Chart using SQL Developer 1.1

At this stage I should point out, that the only 1.1 software you have access to is SQL Developer 1.1 Evaluation Release 1.1.0.21.41. That's what I am going to use. If you do not yet have that release, then go to OTN and follow the links to download it.

Assumptions:
The query I will use in my example is for the user SCOTT/TIGER and requires that you have access to SCOTT's EMP and DEPT tables and a Connection to SCOTT.

Starting with the Reports Tab, select User Defined Reports and, using the context menu, select Add Report. If you're diligent, you could add a folder first, so that all your reports are saved into carefully planned categories.
Once you have invoked the new report dialog, there are three areas you should take special note of:
  • The Style of report, in this case a CHART
  • The SQL text
  • Chart Details
It is obviously important to complete other details, such as name and tooltip, these I'll leave you to do. I want to create a chart of Employees' Salaries per Department. Here's my query. Note, no trailing ';'

select emp.deptno, emp.ename, sal
from emp, dept
where emp.deptno = dept.deptno
order by dept.deptno, sal

When creating a chart, the rule of thumb is select group, series, data from table

Before you test the chart, select the Chart Details and change the chart type to BAR_VERT_STACK. For the rest of the options, you can make your own choices. For bigger reports, the Legend can take up quite a bit of real estate, so I tend to set that to False. You can see what suits you. Once you have set the Chart Details, you can return to the Details tab and Test the chart or just select Apply.

Once back in the Navigator, select your report and select the connection you have for SCOTT.


The stripy pajama report reflects the 4 departments in the table , with each employee and salary. The mouseover for each node indicates Employee name and Salary. The power of the chart is that a glance you can see that, based on my data, Department 20 has the greatest salary bill, while Department 10 appears to have the highest paid employee.

This is a trivial example, but you'll note that the results returned are quite rich. Why not try this against some of your System data?

03 August 2006

SQL Developer Reports: Sneak Peak 2

More in the Sneak Peak series...I'll try to alternate with current and next release blog entries, so that you are not frustrated by future features. As the last entry was on running files in SQL Developer today, it means this entry is a piece about what's coming down the line. (It's mostly screen shots - as before, click each image for larger view.)

I am sure by now you have read and absorbed LewisCunningham's fab article, previously mentioned, covering all SQL Developer reports, shipped and user defined.

In release 1.1 we bring you the same functionality and more. In 1.1, you'll be able to create master/detail reports anduse the new charting capabilities. Also, users will be able to query and kill sessions using this reporting functionality. This latter, a much requested feature. I hasten to add, this is all subject to change, but will give you an idea of what's coming down the line. For more information of planned features, please read the statement of direction on OTN.

The first screen shot illustrates a new report in SQL Developer; a chart displaying the object distribution for a user. You'll also have access to this charting capability, when creating user defined reports.

Of course you'll still have the option of switching users to run the report for another user, without too much difficulty. Below is the same report, but I've switched from HR in my Enterprise database to HR in my XE database, who's not a busy user!

The context menu on this section of reports has also changed. There are a few useful options, including offering you the ability to import or export reports. Notice too that you'll be able to create your own folders and add reports in this section, thus giving you the added benefit of keeping all your Data Dictionary reports together.

Now for a little change to a report you know...

Under the Sessions node, you currently have a Sessions report. In SQL Developer 1.1, this has been changed to a master/detail report, as illustrated in the image below. It would be tedious here to go through each of the tabs, but you can see for the active SYSTEM session selected, more detail is displayed below.

Users with the privileges to do so...

...can kill a session.

Let's briefly look at creating a user defined master/detail report.

I'll do a basic EMP and DEPT report for SCOTT. In the image below, note the ability to test your query. When testing, initially you select and run for a particular database connection. The test feature is all the more useful when you have a more complex report, with a few more clauses, driving the data selection.

I could have chosen to display this as a chart instead. Having selected Chart for the report style, I get more options for defining the chart. See the Chart Details tab to the bottom left.

Now to add the detail (child) report. Note the bind variable matches the column name in the master report.

Before you save the report, you can test it again. This time you'll be testing the full master/detail report and can verify that not only do your queries work, but that you do indeed have the correct binds. I won't show you that test, instead have just shown you the executed report below. Notice the same column ordering ability I mentioned in SneakPeak1.

More sneaks peaks next week.

17 July 2006

Reporting with SQL Developer

Know nothing about the Reports available in SQL Developer? Want to know how to create drill down reports? Oracle Ace Lewis Cunningham (blogs on ITtoolbox ) has written and published a great article about all the reports you can run using SQL Developer. He also goes on to show you how to create your own reports, even your own drill down reports and he gets into the nitty gritty of fixing the titles of parameters for your user defined reports that require parameter screens.

For a few weeks this article will be easily accessible from the front page of OTN, after that we'll link to the article from the SQL Developer home page, so you'll be sure to continue to have access to this detail.