Let's start with a Master-Detail report.
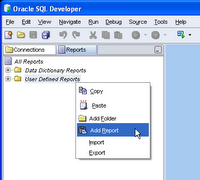
1. Using SQL Developer 1.1 Evaluation Release 2 (1.1.0.21.97) go to the reports tab and select "Add a Report" under the User Defined Reports. I'll leave you to fill in the name, description and tooltip details. The report we are creating uses the demo schema HR, with the EMPLOYEES, DEPARTMENTS and LOCATIONS tables.
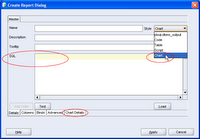
2. Although you only see one panel at this stage, you are creating the Master query. Set the Style as Table and enter the following query:
select d.department_id, department_name, city
from departments d, locations l
where d.location_id = l.location_id
Note: No trailing ';'
You can elect to test the reports at any stage, using the Test button.
3. Now to add the detail.
Select the Add Child button to open a new panel in the dialog.
The basic detail query, without chart or any complexities is as follows:
Select * from employees
where department_id = :DEPARTMENT_ID
Note: The bind is CASE sensitive. Also useful to note, the child query knows that this bind is from the table above.
Another example using that bind variable is:
select :DEPARTMENT_NAME, last_name, salary
from employees where department_id = :DEPARTMENT_ID
It is not that interesting, to have the department name in the detail records, because you'll just see that name duplicated.
4. Run the report to see the master detail in operation.
That's it, a Master -Detail report in action.
Making the Detail a Chart.
Let's take it further and pull the CHART into play...
5. Select Edit to open the report again.
From the previous blog entry on charts, you saw that we need to select X, Y and data, so we'll do the same here. Replace the child query with:
select m.last_name, e.last_name, e.salary
from employees e, employees m
where m.employee_id = e.manager_id
and e.department_id = :DEPARTMENT_ID
So now I am looking at the departments table and for each department, I want to know who works for each manager in that department and see their salaries.
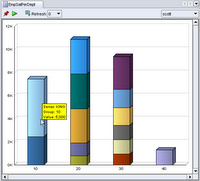
To create the chart, set the child style to CHART and then look at the chart details and set them to BAR_VERT_STACK and select the Test button.
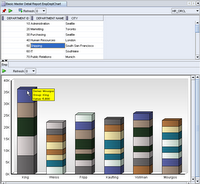
When you are happy select Apply. Here's mine:


